
Both gold and the US dollar go up and down. If gold really were just the anti-dollar, then its rise would be mirrored by a fall in the USD and vice versa. The locus of points traced out on a graph of the US dollar index vs gold should be an hyperbola, and we often observe this relationship.
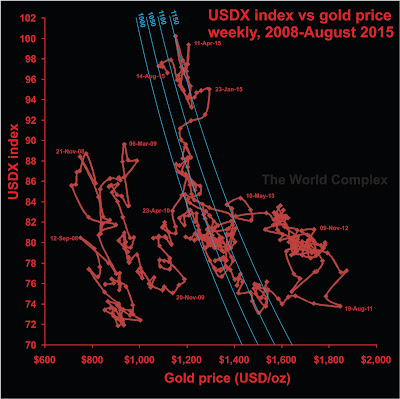
In the past year, the US dollar has risen quite sharply. For the first several months, gold also rose, apparently continuing the nearly linear trend we last observed in the first half of 2010. The last several months, gold and the US dollar seem to be acting in their somewhat inverse relationship, mostly at about the 1100 isoquant.
The 1000 isoquant seems to have been the key support since 2010, and I would be very surprised if that "level" were breached except transiently. Currently we are at about 1050 (you can calculate it by multiplying the USD price of gold per ounce by the USDX index value, dividing the result by 100).
No comments:
Post a Comment